


When a mess is an opportunity. A tale in two parts
When a mess is an opportunity. A tale in two parts
Part I: It's almost time to pounce..

How would you describe todays global supply chain? A mess. Can’t get containers moved from port, can’t get truck drivers, parts not available, no semi-conductors in the age of an inter-connected economy. Today in the UK, it is quite normal to be out of stock of regular goods like toilet paper, can’t source GPU’s for months and today I’m unable to source a guitar until after Christmas for my son. Whilst this has impacted everyone’s every day life in the West, the impact on commodity markets has been acute. One of the consequences of supply chain issues is that commodity markets have been pushed and pulled to try and resolve these inefficiencies in an attempt to get product to where it needs to be. Generally, this has meant higher prices in attempt to slow demand. Below are some charts highlighting the various impacts that these bottlenecks have had and the inflationary impulse it is emitting to the global economy.
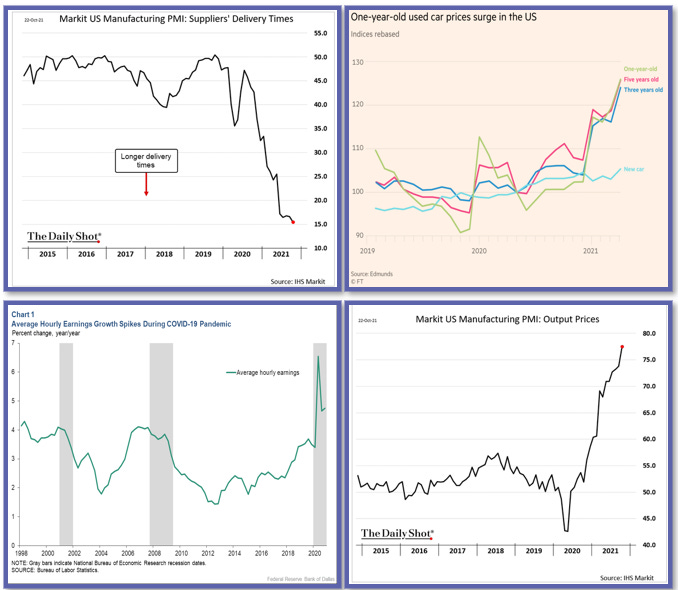
For now consumer demand remains robust in the face of ever increasing supply side cost increases. At what point do “higher prices cure higher prices” or does the supply chain crisis resolve itself?
If you are want to look for a pre-COVID but relatively recent example of what a commodity market does when supply is constrained look at iron ore. Iron ore is used in the production of steel for various uses. One of the common uses in for iron ore is to produce Rebar (short for “reinforcing bar”) that is used to reinforce concrete and common in construction. In January 2019, prior to COVID, when the terrible tragedy hit the $VALE mine in Brazil, iron ore prices spiked. This was the start of a bull market that lasted about two and half years. Due to restrictions on supply on safety grounds, a large part of Brazil supply of iron ore was not available at any price. The winners? Australian miners mostly, such as RIO, BHP and FMG. Once COVID hit, the iron ore price was barely impacted, and with all the stimulus on housing in China and on infrastructure globally, the demand for steel increased at the same time that supply was being curtailed. This drove prices for iron ore significantly higher in one of the strongest bull markets I have seen in nearly 20 years of markets. This ebb and flow continued until the crescendo in the Summer of 2021.

The iron ore price decline has been a classic, “up by the stairs, down by the elevator” market move. The weakness has been brought about by several factors, mainly on a dampening of of steel demand in China on ESG grounds but also the overwhelming supply response once constraints were removed, and the incentive it provided marginal suppliers who’s typical cost of production is > $100. The result is best displayed in the charts below with iron ore inventories rising and margins to produce steel relatively flat. (Thanks to Macquarie Research for the charts).


Zooming out again, the macro consequence of the supply chain bottlenecks and labour shortages has been in rise in inflation and the debate as to whether its transitory or not. This piece is not going to get into that. But lets say my view is that there will be idiosyncratic opportunities to be long and short different commodities. Going forward, just being long will not always be a winning strategy. Look at Iron Ore. In less than 4 months you are almost back to where the bull market begun in Q1 2019 in one of the most important commodities that will be behind the West’s “Build Back Better” narrative. What gives?
From this mess comes opportunity. Because of various policies related to COVID, ESG and geo-politics we are seeing inefficiencies arise across many commodity markets. Lets take a look at a couple of soft commodities, Cotton and Coffee. Part 1 of this report is focused on Cotton. Coffee to follow.
Cotton
Policy Stokes Demand
Because of concerns over the treatment of workers in Xinjiang, the US government took action banning shipments of goods implicated in forced labour and passing the Uyghur Forced Labour Prevention Act. As a consequence a number of US firms banned the use of cotton fibre grown in the region to be used in garments sold in the US. [As an aside. A large percentage of the imported cotton spun into yarn and fabric in China is manufactured in Xinjiang anyway. So I am not sure it has really helped the local Uyghurs that much by banning the use of local cotton].
What has this done? Chinese textile mills had to source machine picked cotton from other sources. Where are these sources? USA, Brazil and Australia. Due to consecutive small crops in Australia, in conjunction with an effective ban of importing Australian cotton into China, this left the US and Brazil to provide China with the cotton it required.
On top of this thanks to the “Trade Deal 1.0” (remember those headlines in 2018-19 on Twitter from DJT?) China is incentivised to buy US cotton over other origins in attempt to address the trade imbalance. The result, China imports almost 13m bales in 2020/21 vs just over 7m bales in 2019/20.
Supply - Logistics favour the US
Despite all the headlines about what a mess the ports in the US are. On a relative basis the availability of containers that go back to China is much better than other cotton producing countries. This availability meant cheaper freight rates for containers compared to other origins of cotton means the US has a freight advantage vs competing origins into shipping to Asia.
The China-US trade route is the dominant global container route and today the US is demanding records amounts of goods. Ocean freight companies are exploiting this by providing as many containers to this route at the expense of other routes to take advantage of the very high freight rates. Other trade routes that are important for the cotton supply chain such as Brazil to the sub-continent, West Africa to the sub-continent or Australia to SE Asia have been left behind. In November, as we get into the height of the US harvesting and export season, US cotton is left as the only game in town for as a source machined picked cotton.

The role freight is playing in this dynamic is interesting. Most competing sources of cotton are trading at heavy discounts vs. US cotton on an equivalent FOB or domestic basis. However, because the US to Asia freight rate is lower than the competition, the landed price of US cotton into consuming markets is competitive.
For some countries it is not a case of the freight being too high but simply availability. West Africa ships a lot of cotton to Bangladesh which is a very large consumer of cotton. However, you cannot get a commitment by carriers to make containers available in West Africa to ship to Bangladesh. There has been talk of using break bulk shipments of cotton out of West Africa to Bangladesh to get around the shortage of containers.
How does this get resolved?
So the domestic markets of competing growths of cotton have to either:
i) Trade at an even cheaper discount vs US cotton to allow for the more expensive freight, this could be driven by capitulation of the farmers or a much stronger USD;
ii) Futures prices go so high that it “breaks” the basis of foreign growth cotton so that the producers do sell at a nominally high price (but cheap basis price), or;
iii) Freight rates normalise.
Currently, the path taken seems to be number ii) above. Yes the basis levels have not broken enough to resolve the difference in freight. US cotton is still relatively well priced on a landed to destination market basis.
It is not clear to from the signals the market is sending what is the most viable path is over the next few months. If we do get a pullback in price of 10-15% but the freight rates are still high, China demand is still strong and other origins of cotton can still not compete because of supply chain constraints, then the futures price could keep marching higher and above recent highs of 120.
Things to consider
Delivery economics
The December contract expires this month. In theory, you can buy cotton from farmers today and deliver to the exchange and make a risk free profit. The problem is you can’t buy a bale. The crop year (officially starts in August of each year for US Cotton) started with low inventories, and due to the dynamics described above the carry over inventory sold out and the early crop was committed to be sold for export. So the December contract was allowed to become “unhinged” from delivery economics because there was no cotton to deliver. See the certified stocks numbers below. We are down to less than 200 bales heading into First Notice Day for the December 2021 futures contract.
However, the March contract delivery period is in February. A lot of non-US cotton is hedged on that month mostly from India as well as other origins. The commercial participants prefer a carry market (contango) over an inverted (backwardated) market. The ones not able to roll their positions early, have just had to roll their hedges at a 2-3 cent loss from December to March. There is a lot of incentive for commercials to either cancel or defer sales of US cotton from Q1 into Q2 and deliver cotton to the exchange and try and force carry into the market.
For a case in point, despite impending tightness in the market earlier this year, the commercials did manage to create enough certified cotton stocks to force carry back into the market from the July to December contracts. Below is the chart of certified stocks on the ICE Cotton No.2 Contract. As you can see, at the moment, there is almost none.

Futures market positioning
Heading into the week before December First Notice Day, the managed money position is very large. The net spec position is just shy of 90k lots net long which is about 75% of the historical maximum. Recently it was above 100k lots which is getting close to the record highs we have seen in the past. An historical chart of position is below. The size of positioning is a worry for longs, but seasonality is generally bullish into the end of the year, and then you have the fund in-flows in the first half of January. So betting on a washout in positioning in the short term is not a high probability bet.

However, if the cash market in the US remains cheaper than the price the futures market is paying you for cotton into Q1, something has to give. Timing the short side of a trade based on a normalisation in freight rates and relative basis levels is very challenging so there are a few different signals to look for.
Signs to look out for
Weakening cash basis in the US or a relative strength in non-US basis vs US basis suggesting they were gaining market share.
An ability of non-US cotton to start to win export business
Container freight rates to weaken and/or supply chain bottlenecks to ease
Container availability in Brazil, Australia and West Africa to improve.
Domestic logistics in the US become more challenging, meaning exports cannot leave the country, thereby increasing stocks within the US. This could be a scenario where the commercials would deliver more stock to the futures exchange and be generally bearish for spreads and flat price.
Strategy
Outright shorting the Mar-22 futures contract is the most bold strategy but could be too early. So it might be a better bet to put any short bets on the May-22 contract. As of the 18th November this is where the calendar spreads are trading (a positive number is inverted/backwardated):

If there is a change in the freight rate dynamic or if the competing foreign growth cotton became so cheap that the risk/reward became so compelling then US cotton’s competitiveness would be challenged and this would be bearish for US futures. The best way to express this view in the cotton market would be one of the following strategies:
Easiest: would be to sell the Mar-22 (or May) contract vs. buying the July-22 contract
Most Difficult: Buy physical cotton in the US, sell Mar-22 futures and close the arbitrage by delivering cotton to the exchange
Most risky: Short Mar-22 cotton futures
To conclude, even if this more bearish scenario plays out, which I think it will in Q1 2022, the bullish story for cotton is not entirely over for 2022. New crop December 2022 cotton is still relatively cheap vs. competing crops and costs of production across all crops are significantly higher YoY thanks to fertilizer, fuel, machinery and labour costs. There is always another trade.
Next… Coffee